

INTRODUCTION
Polycyclic aromatic hydrocarbons (PAHs) are organic compounds composed of multiple aromatic rings, formed through the incomplete combustion of carbon-containing materials, and known for their carcinogenic risks. Their derivatives, such as nitrated PAHs and oxygenated PAHs, pose similar health hazards due to added functional groups and can present significant mutagenic risks.
The harms to health caused by smoking do not only affect the lungs but nearly every organ of the body1. Anyone exposed to cigarette smoke is at higher risk of developing a wide range of health problems such as respiratory disease, cardiovascular disease, and several cancers including lung, mouth, throat, stomach, liver, and bladder1. Tobacco smoke consist of a mixture of gaseous and particulate-bound compounds containing thousands of chemicals, of which some are considered carcinogenic to human health2-4.
Among the toxicants present in tobacco smoke are the PAHs: a large group of combustion-related organic compounds classified as probably carcinogenic to humans by the International Agency for Research on Cancer (IARC)5. Benzo[a]pyrene (BaP) is the only one classified as carcinogenic to humans6,7 and is commonly used as an indicator of total PAHs toxicity8,9. PAHs are produced during incomplete combustion of complex molecules such as plant phytosterols10,11 which can be found in different forms (e.g. free sterol, steryl ester, steryl glycoside, acylated steryl glucoside)11,12. The diversity of phytosterols depends on tobacco cultivar and cultural practices12,13.
Predominant emissions of PAHs in the atmosphere are from anthropogenic sources (e.g. vehicle emissions, industrial activities) while biogenic sources (e.g. volcanic eruption, forest fires) are considered less significant to total emissions14. PAHs consists of two or more fused aromatic rings, with the two and three aromatic ring PAH compounds predominantly found in the gas phase whilst the four-ring PAHs partition between the gas and particle phase15,16. Those with five and six aromatic rings are considered more toxic than PAHs with fewer rings, and they are predominantly found in particulates due to their high molecular weights and low volatility15,16.
In tobacco cigarettes, studies have focused on parent PAH emissions especially benzo[a]pyrene17,18. However, little attention has been given to PAH derivatives, the oxygenated PAHs (oxy-PAHs) and nitrated PAHs (nitro-PAHs), in biofluids of smokers and vapers. Previous studies have focused on measuring few biomarkers or metabolites in urine to confirm human exposure to oxygenated and nitrated PAHs in urine19,20. Luo et al.19 quantified phenanthrene-quinones (0.79 ± 0.98 nmol/6h urine) as biomarker of exposure to oxygenated PAHs in urine of cigarette smokers. Gong et al.20 have reported the urinary metabolites levels of nitro-PAHs in 111 healthy and non-smoking adults in Beijing, China, whereas 1- and 2-amino-naphthalene (0.27 to 0.34 ng/mL) were targeted as metabolites of 1- and 2-nitro-naphthalene, and 1-amino-pyrene (0.09 to 0.11 ng/mL) as metabolite of 1-nitropyrene.
Oxy-PAHs and nitro-PAHs also exist as complex mixtures in both the gas and particle phases and there is some debate over whether they are predominantly co-generated with PAHs through incomplete combustion or formed photochemically from PAHs through photochemical reactions. Unlike PAHs, both oxy-PAHs and nitro-PAHs are considered direct-acting mutagens to human cells and carcinogens14. Despite this, there is both a lack of studies and of analytical methods for their detection in biofluids.
In recent years, many smokers are choosing electronic cigarettes (e-cigarettes) which heat nicotine over traditional tobacco cigarettes for the purpose of imitating the flavors and act of smoking, and to greatly reduce their exposure to harmful chemicals emitted from burning traditional cigarettes21. However, recent studies continue to suggest that e-cigarettes are not risk-free and can cause health issues affecting lungs and heart22. Vapers can also be exposed to other harmful substances including volatile organic compounds (VOCs), toxic metals, nitrosamines, and PAHs23,24. Recent review articles concluded that the safety of e-cigarettes is not well understood, and more studies are needed to assess the short- and long-term impact of e-cigarette use on human health21,22.
In this context, the objective of this study is to assess the presence of PAH biomarkers and derivatives in the urine of volunteers who accepted to switch from traditional cigarette use to e-cigarette-only use. The results from this study evaluate for the first time if the users of e-cigarettes have reduced risks from both PAHs and their genotoxic derivatives. This study includes data comparison of the urine samples analyzed using the solid phase extraction and liquid injection (SPE-LI) gas chromatography mass spectrometry (GC-MS) method and the solid phase micro-extraction SPME-GC-MS.
METHODS
Samples collection
Samples analyzed in this study were collected in 2016 as a collaboration between UKHSA (previously Public Health England) and St George’s University of London, for the Horizon 2020 project ‘Multidisciplinary tools for improving the efficacy of public prevention measures against smoking’ (SmokeFreeBrain, Project number 681120). Ethical approval was received from NHS HRA, London-Bromley Research Ethics Committee on 7 June 2016 (REC reference:16/LO/0935). Urine samples were collected at St George’s University of London (SGUL) and at St George’s Clinical Research Facility (CRF). Fifty-four male and female adults who consumed >10 cigarettes per day and were willing to switch to e-cigarettes volunteered to provide urine samples during 6 visits in 28 days, covering the transition period from using traditional cigarettes to e-cigarettes only. To minimize bias, we focused on recruiting volunteers from the same region, thereby reducing individual variability due to environmental factors such as local air pollution. Participants were aged 20–68 years, and they were free to choose their EC model, flavor, and nicotine strength, as long as they were purchased from an authorized retailer (e.g. pharmacy, leading supermarket). Participants were provided with unbiased guidance from reliable sources, such as NHS England, to assist them in selecting an appropriate initial nicotine concentration based upon their cigarette consumption. Sample collection consisted of 6 visits for each participant, 2 visits prior to quitting for screening and baseline (visits 1 and 2), and 4 visits (visits 3, 4, 5, and 6) after switching to e-cigarettes on days 3, 7, 21 and 28. The expired carbon monoxide (CO) level was used to assess heavy smokers at baseline visits by showing expired CO values ≥10 ppm, whereas smoking abstinence was assessed by expired CO values <8 ppm during the 4 visits after switching to EC. Only 31 from the 54 participants completed all 6 visits, and the samples were then stored at UKHSA (Didcot, UK) at -80°C. One hundred samples from 20 participants, each providing 5 urine samples after completing all visits, were used in the present study.
Chemical standards
The choice of the organic compounds investigated in this study is based on the most common PAH derivatives identified in environmental samples and commercially available standards8,14. All compounds are listed in Table 1 and were purchased from Scientific Laboratory Supplies Ltd (SLS), Alfa Aesar, and Merck in the UK with a minimum purity of 97%. Deuterated compounds were purchased from LGC, UK.
Table 1
List of PAH biomarkers, their derivatives, their surrogate standards, and their abbreviations. For each compound, the targeted mass ions are listed in descending order of their m/z values. The retention times are provided for both the liquid injection (LI) method and the solid phase microextraction (SPME) method
| Compound/Formula | Abbreviation | Mass ions | Retention time (min) | |
|---|---|---|---|---|
| ±0.1 | LI | SPME | ||
| 2 PAH biomarkers + 2* | ||||
| 2-Naphtol/C10H8O | 2-NPL | 144, 116, 115 | 10.92 | 9.51 |
| 2-Naphtol-D8* | 2-NPL-D8 | 152, 151, 150, 122, 121 | 10.89 | 9.50 |
| 1-Hydroxypyrene/C16H10O | 1-OH-PYR | 218, 189, 190, 95 | 15.32 | 13.89 |
| 1-Hydroxypyrene-D9* | 1-OH-PYR-D9 | 227, 198, 197, 196 | 15.28 | 13.88 |
| 5 Oxy-PAHs + 2* | ||||
| 1,4-Naphthoquinone/C10H6O2 | 1,4-NPQ | 158, 130, 104, 102, 76 | 10.25 | 8.85 |
| 1,4-Naphthoquinone-D6* | 1,4-NPQ-D6 | 164, 136, 108, 80 | 10.20 | 8.82 |
| 2-Hydroxy-1,4-Naphthoquinone/C10H6O3 | 2-OH-1,4-NPQ | 174, 146, 105, 77, 69 | 11.12 | NF |
| 9-Fluorenone/C13H8O | 9-FLU | 180, 152, 151, 150 | 12.28 | 10.89 |
| 9-Fluorenone-D8* | 9-FLU-D8 | 188, 160, 158, 156 | 12.23 | 10.87 |
| 9,10-Anthraquinone/C14H8O2 | 9,10-AQ | 208, 180, 152, 151, 76 | 13.36 | 12.06 |
| 1,8-Naphtalic anhydride/C12H6O3 | 1,8-NANH | 198, 154, 126 | 13.60 | NF |
| 6 Nitro-PAHs + 2* | ||||
| 1-Nitronaphthalene/C10H7NO2 | 1-NNL | 173, 145, 127, 115, 126 | 11.51 | 10.11 |
| 4-Nitrophenol/C6H5NO3 | 4-NPH | 139, 109, 93, 81, 65 | 10.90 | 9.53 |
| 2-Methyl-4-nitrophenol/C7H7NO3 | 2-M-4-NP | 153, 123, 77, 73 | 11.33 | 9.97 |
| 2-Nitrofluorene/C13H9NO2 | 2-NFL | 211, 194, 165, 164, 163 | 13.88 | 12.62 |
| 2-Nitrofluorene-D9* | 2-NFL-D9 | 220, 174, 172, 170 | 13.84 | 12.60 |
| 9-Nitroanthracene/C14H9NO2 | 9-NAC | 223, 193, 177, 176, 165 | 13.98 | 12.76 |
| 1-Nitropyrene/C16H9NO2 | 1-NPYR | 247, 217, 201, 200, 189 | 15.82 | 14.26 |
| 1-Nitropyrene-D9* | 1-NPYR-D9 | 256, 226, 210, 208, 198 | 15.77 | 14.26 |
Analytical methods
The chemical analysis was conducted by the Analytical Toxicology Group at UKHSA Chilton. Three analytical methods were developed and compared to determine the best sensitivity for oxy- and nitro-PAHs using the GC-MS in electron ionization (EI) mode. We used solid-phase extraction with liquid injection (SPE-LI) on a single quadrupole GC-MS (Thermo Trace 1310 - ISQ LT), and the headspace (HS) and direct-immersion (DI) Solid-Phase Microextraction (SPME) on a triple quadrupole GC-MS/MS (Agilent 7890B - 7010B). The limit of detection (LOD) in all methods was defined as the valid lowest measurable peak response to peak noise near the elution time of the target peak (S/N = 3) in a mix of standard solutions. For the analysis of urine samples, the limit of quantification (LOQ) was defined as S/N =10 from spiked urine.
Sample preparation
One hundred urine samples from 20 participants who had completed visits 2 to 6 were deconjugated with β-Glucuronidase enzyme from Escherichia coli (25 KU, Lyophilized powder, Sigma Aldrich) to free the analytes from their conjugated form as hydrophilic glucuronide. β-Glucuronidase powder was first dissolved in 2 mL ammonium acetate buffer (1M, pH 5) with concentration corresponding to 12.5 KU/mL.
A volume of 2.8 mL was taken from each urine sample to use for all GC-MS analysis methods (SPE-LI, HS-SPME and DI-SPME) and then mixed with 400 μL ammonium acetate buffer (1M, pH 5) and 38.4 μL from the β-Glucuronidase solution of 12.5 KU/mL to obtain about 150 U in a total volume of 3238.4 μL ‘solution A’. Enzymatic deconjugation was performed for 2 h at 37°C in water bath incubator. Solution A was then split into 1 mL for SPE-LI, 0.5 mL for HS-SPME and 1.3 mL for DI-SPME. The samples were stored at -20°C until analysis by GC-MS.
Liquid injection on GC-MS
SPE was used to clean up samples to help maintain a clean GC injection inlet liner and avoid column contamination. Urine samples and method blanks (ACN + Buffer) were purified on Swift HLB SPE cartridges (1 mL, Supelco) to reduce the impacts of interfering compounds during GC-MS analysis. SPE consisted of loading 1 mL of ‘solution A’ directly onto the SPE sorbent bed, followed by a washing step with 1 mL of 5% ACN + 95% H2O, and finally elution of analytes with 1 mL ACN into a 2 mL glass autosampler vial. External standard calibrations were prepared in acetonitrile (Optima LC-MS grade, Fisher Scientific) at concentrations of 10, 50, 100, 200, 300, 400, 500 ng/mL. Calibration solutions were analyzed 5 times in the same sequence for urine samples and blanks and a 7-points calibration curve was obtained with correlation coefficients greater than 0.98.
Quality control (QC) samples consisted of solvent blanks, method blanks, and 4 urine samples spiked with 6 surrogate standards (Table 1) at 200 ng/mL. Only 9-FLU has been detected in all method blanks (ACN + Buffer + SPE) but not in solvent blanks, which may be due to contamination of SPE cartridges. The method blanks contribution to 9-FLU was corrected in the final data. To calculate the recovery of analytes using the SPE method; the surrogate standards were spiked in 4 urine samples before SPE and 4 other urine samples after SPE. The surrogate standards used in this study are shown in Table 1 and correspond to a mixture of two deuterated PAHs (1-hydroxypyrene-d9 and 2-naphtol-d8), two deuterated oxy-PAHs (9-fluorenone-d8 and 1,4-naphthoquinone-d6), and two deuterated nitro-PAHs (1-nitropyrene-d9 and 2-nitrofluorene-d9). The recovery of each surrogate standard was calculated as the ratio between the amount quantified from urine samples spiked before and after using SPE. One spiked sample (before SPE) and its duplicate (after SPE) were run 5 times/day on 2 consecutive days to calculate the intra- and inter-day relative standard deviation (RSD). External calibration of surrogate standards in ACN (concentrations at 50, 100, 200, 300, 400 ng/mL) was run 3 times during the sequence run to quantify surrogate standards.
Target compounds were identified and quantified using a GC (Thermo GC Trace 1310) coupled to a single quadrupole MS (Thermo ISQ LT). Liquid injections on the GC-MS were automated using a TriPlus RSH autosampler. The separation of analytes was performed on SLB-5ms capillary GC column (Supelco, low polarity phase, 5% phenyl /95% dimethyl siloxane, 30 m length, 0.25 mm diameter, 0.25 μm film thickness). A volume of 1.2 μL of each sample was injected in the GC inlet at 280°C with a splitless time of 3 minutes. Helium was used as a carrier gas at a constant flow of 0.9 mL/min with constant septum purge flow at 3 mL/min. The mass spectrometer was operated in electron ionization (EI) mode at 70 eV, with MS transfer line temperature at 300°C, dwell time of 10 ms, and ion source temperature at 250°C. The GC initial oven temperature was set at 60°C for 3 min, increasing to 220°C at a heating rate of 20°C/min, followed by 30°C/min to 310°C and held for 4 min to ensure the elution of all analytes from the column. All target compounds were identified and quantified using Thermo Xcalibur Quantitative Software.
Solid phase microextraction on GC-MS
SPME has gained popularity in many fields of application in recent years because it is a simple, sensitive, and solvent-free technique for the extraction of analytes from gaseous, liquid, and solid samples. The SPME method is based on the partitioning of analytes between the fiber and the sample, after exposure of the fiber to the vapor phase above the sample (HS-SPME) or by direct immersion into the sample solution (DI-SPME). Heating the sample during the extraction phase accelerates the release of analytes from the sample to reach equilibrium. The analytes are adsorbed onto the fiber and then desorbed into the analytical column at high GC inlet temperature between 200°C and 300°C depending on the fiber coating and thickness.
In this study, 1.8 mL of the deconjugated urine samples were split into 1.3 mL for DI-SPME and 0.5 mL for HS-SPME. Five calibration solutions of target compounds in Table 1 were prepared in Sigmatrix urine diluent (Sigma-Aldrich) that mimics human urine, at concentrations of 1, 10, 50, 100, and 200 ng/mL. The calibration standards were tested in both DI-SPME and HS-SPME to compare and select the best approach for extraction of analytes, in Table 1, from the sample matrix. The best sensitivity of target compounds was obtained from DI-SPME (see results). QC samples consisted of 5 random urine samples spiked with 6 surrogate standards (Table 1) at 50 ng/mL and analyzed twice within the sample sequence. Two spiked urine samples were analyzed 5 times a day on 2 consecutive days to evaluate the intra- and inter-day RSD. The recovery of each surrogate standard was calculated as the ratio of the amount quantified by GC-MS from each of the 5 spiked urine samples against the calibration of surrogate standards (concentrations at 10, 25, 50, 75, 100 ng/mL) measured simultaneously within the analysis of the samples. QC blanks (urine diluent, H2O, and H2O + buffer) demonstrated a low amount of chemical carryover for 9-FLU, 2-NPL, and 1-OH-PYR during the sequence run. Blank offset correction was included in the calibration curve for each of the compounds detected.
The SPME fiber divinylbenzene (PDMS/DVB) (Supelco, 1 cm length, 65 μm thickness, 23 Ga needle, operating temperature 200–270°C) was chosen in this study based on the supplier recommendation for its suitability to extract VOCs, amines, and nitroaromatics. The fiber was first conditioned before first use for 30 min at 250°C in the autosampler conditioning unit (PAL RTC 120) and changed after running 70 samples. The fiber was then inserted 25 mm (DI-SPME) into the 2 mL autosampler vial (filled to 1.3 mL) and incubated at 70°C for 30 min to extract our targeted analytes in Table 1.
Target compounds were identified and quantified using a GC (Agilent 7890B) coupled to a triple quadrupole MS (Agilent 7010B). Target compounds were separated on a Rxi-5ms GC capillary column (Restek, low polarity phase, 5% diphenyl /95% dimethyl polysiloxane, 15 m length, 0.25 mm diameter, 0.25 μm film thickness). Helium was used as a carrier gas at a constant flow of 1 mL/min with constant septum purge flow of 3 mL/min. The SPME fiber was injected and thermodesorbed for 3.5 min in the GC inlet liner (Restek, Topaz 0.75 mm ID straight SPME liner) in splitless mode at 265°C and purge flow of 30 mL/min at 3.1 min. A 2-min fiber post-desorption conditioning at 250°C was performed after each sample analysis. The oven program was identical to the one used for SPE-LI analysis. The mass spectrometer was operated in MS2 scan time segments where each segment covers the retention time, precursor ions, and ions fragments of each compound. The gain was optimized for each compound and varied between 2 and 5 to achieve high ion response and best peak shape. The MS transfer line was set at 300°C, dwell time 20 ms, and the ion source operated in EI mode at 70 eV, 230°C.
The data were recorded and processed using the Agilent MassHunter Qualitative and Quantitative analysis software. Target compounds were identified by the combination of retention time and mass spectral match against the calibration standards measured simultaneously within the samples.
To optimize the DI-SPME method, we used a calibration mix of the targeted compounds at 50 ng/mL in ultrapure water. Then, we analyzed the calibration mix at different incubation temperatures (50, 60, 70, 80°C) and extraction times (20, 30, 40 min). On the GC, we compared inlet temperatures at 265 and 270°C, and column flow rates at 0.9 and 1.0 mL/min of helium.
RESULTS
Detection limit comparison between SPE-LI and DISPME on GC-MS
A mix of chemical standards at different concentration levels was used to compare the LOD and LOQ of each compound in SPE-LI and DI-SPME methods. The LOD and LOQ were determined based on visual evaluation of the signal of each compound at its lowest concentration and the signal-to-noise (S/N) ratio calculated by the GC-MS software. An S/N of 3 and 10 were chosen for LOD and LOQ, respectively. The DI-SPME showed a better sensitivity than SPE-LI for all compounds in Table 2, except for: 2-OH-1; 4-NPQ; 1,8-NANH; and 4-NPH, which were not detected in the mix of standards up to 500 ng/mL. This might be related to insufficient adsorption of the compounds onto the PDMS/DVB fiber used in this study or to its degradation during the incubation step. Other fiber coatings, length, and thickness (e.g. SPME Arrow) may improve the sensitivity of: 2-OH-1; 4-NPQ; 1,8-NANH; and 4-NPH, in DI-SPME.
Table 2
Comparison of concentrations (ng/mL) of limits of detection (LOD) and limits of quantification (LOQ) using SPE-LI (GC-SQ-MS) and DI-SPME (GC-TQ-MS)
The lowest LOD was attributed to 9-FLU at 0.02 ng/mL using DI-SPME, 50 times lower than using the SPE-LI method with LOD for 9-FLU at 1 ng/mL. LOD and LOQ of most nitro-PAHs were significantly lower in DI-SPME than SPE-LI.
Error estimation using SPE-LI and DI-SPME on GC-MS
In addition to LOD and LOQ determination, the assessment of the method precision and accuracy are important factors in method validation. These two factors can be used to confirm that analytes of interest can be reliably measured by an analytical procedure. As part of our method validation, we compared the precision of repeated measurements and recovery efficiency of analytes between SPE-LI and DI-SPME methods. We have evaluated the precision (random) error described as the agreement between analytes in repeated measurements. The precision error has been estimated from the relative standard deviation (RSD) (Table 3) of replicate analysis of two urine samples spiked with deuterated-labelled compounds and analyzed 5 times a day on 2 consecutive days to evaluate the inter- and intra-day RSD. The RSD average was mostly <15% in both SPE-LI and DI-SPME methods, which indicates a good repeatability of the measurements using both methods. The accuracy evaluation was based on the recoveries from surrogate standards, and they showed an average of 45% (SPE-LI) and 102% (DI-SPME) for deuterated nitro-PAHs, 66% (SPE-LI) and 92% (DI-SPME) for deuterated oxy-PAHs, 68% (SPE-LI) and 97% (DI-SPME) for deuterated PAH biomarkers. Therefore, the DI-SPME method has produced better agreement in precision and accuracy measurements than SPE-LI.
Table 3
Comparison of relative standard deviation (%) between SPE-LI (GC-SQ-MS) and DI-SPME (GC-TQ-MS)
Moreover, the systematic error is also an important source of error which may be due to the influence of the sample matrix on the calibration offset accuracy during the quantification step within the calibration linear response curve; it was estimated to be a maximum of 25%. Therefore, the estimated error combining the precision and the systematic effects, is a maximum of 40% in both SPE-LI and DI-SPME.
Other factors such as solvent and method blanks are used to determine background contamination and interferences from the analytical system. Blanks were analyzed following the same procedure as for the samples. In SPE-LI method, 9-FLU was detected in all method blanks and corrected in the final data. In the DI-SPME method, a few blanks have shown low response to 9-FLU, 2-NPL, and 1-OH-PYR during the sequence run and this was corrected using the blank offset adjustment in the calibration curve for each of the compound detected.
Comparisons between DI-SPME and HS-SPME on GC-MS
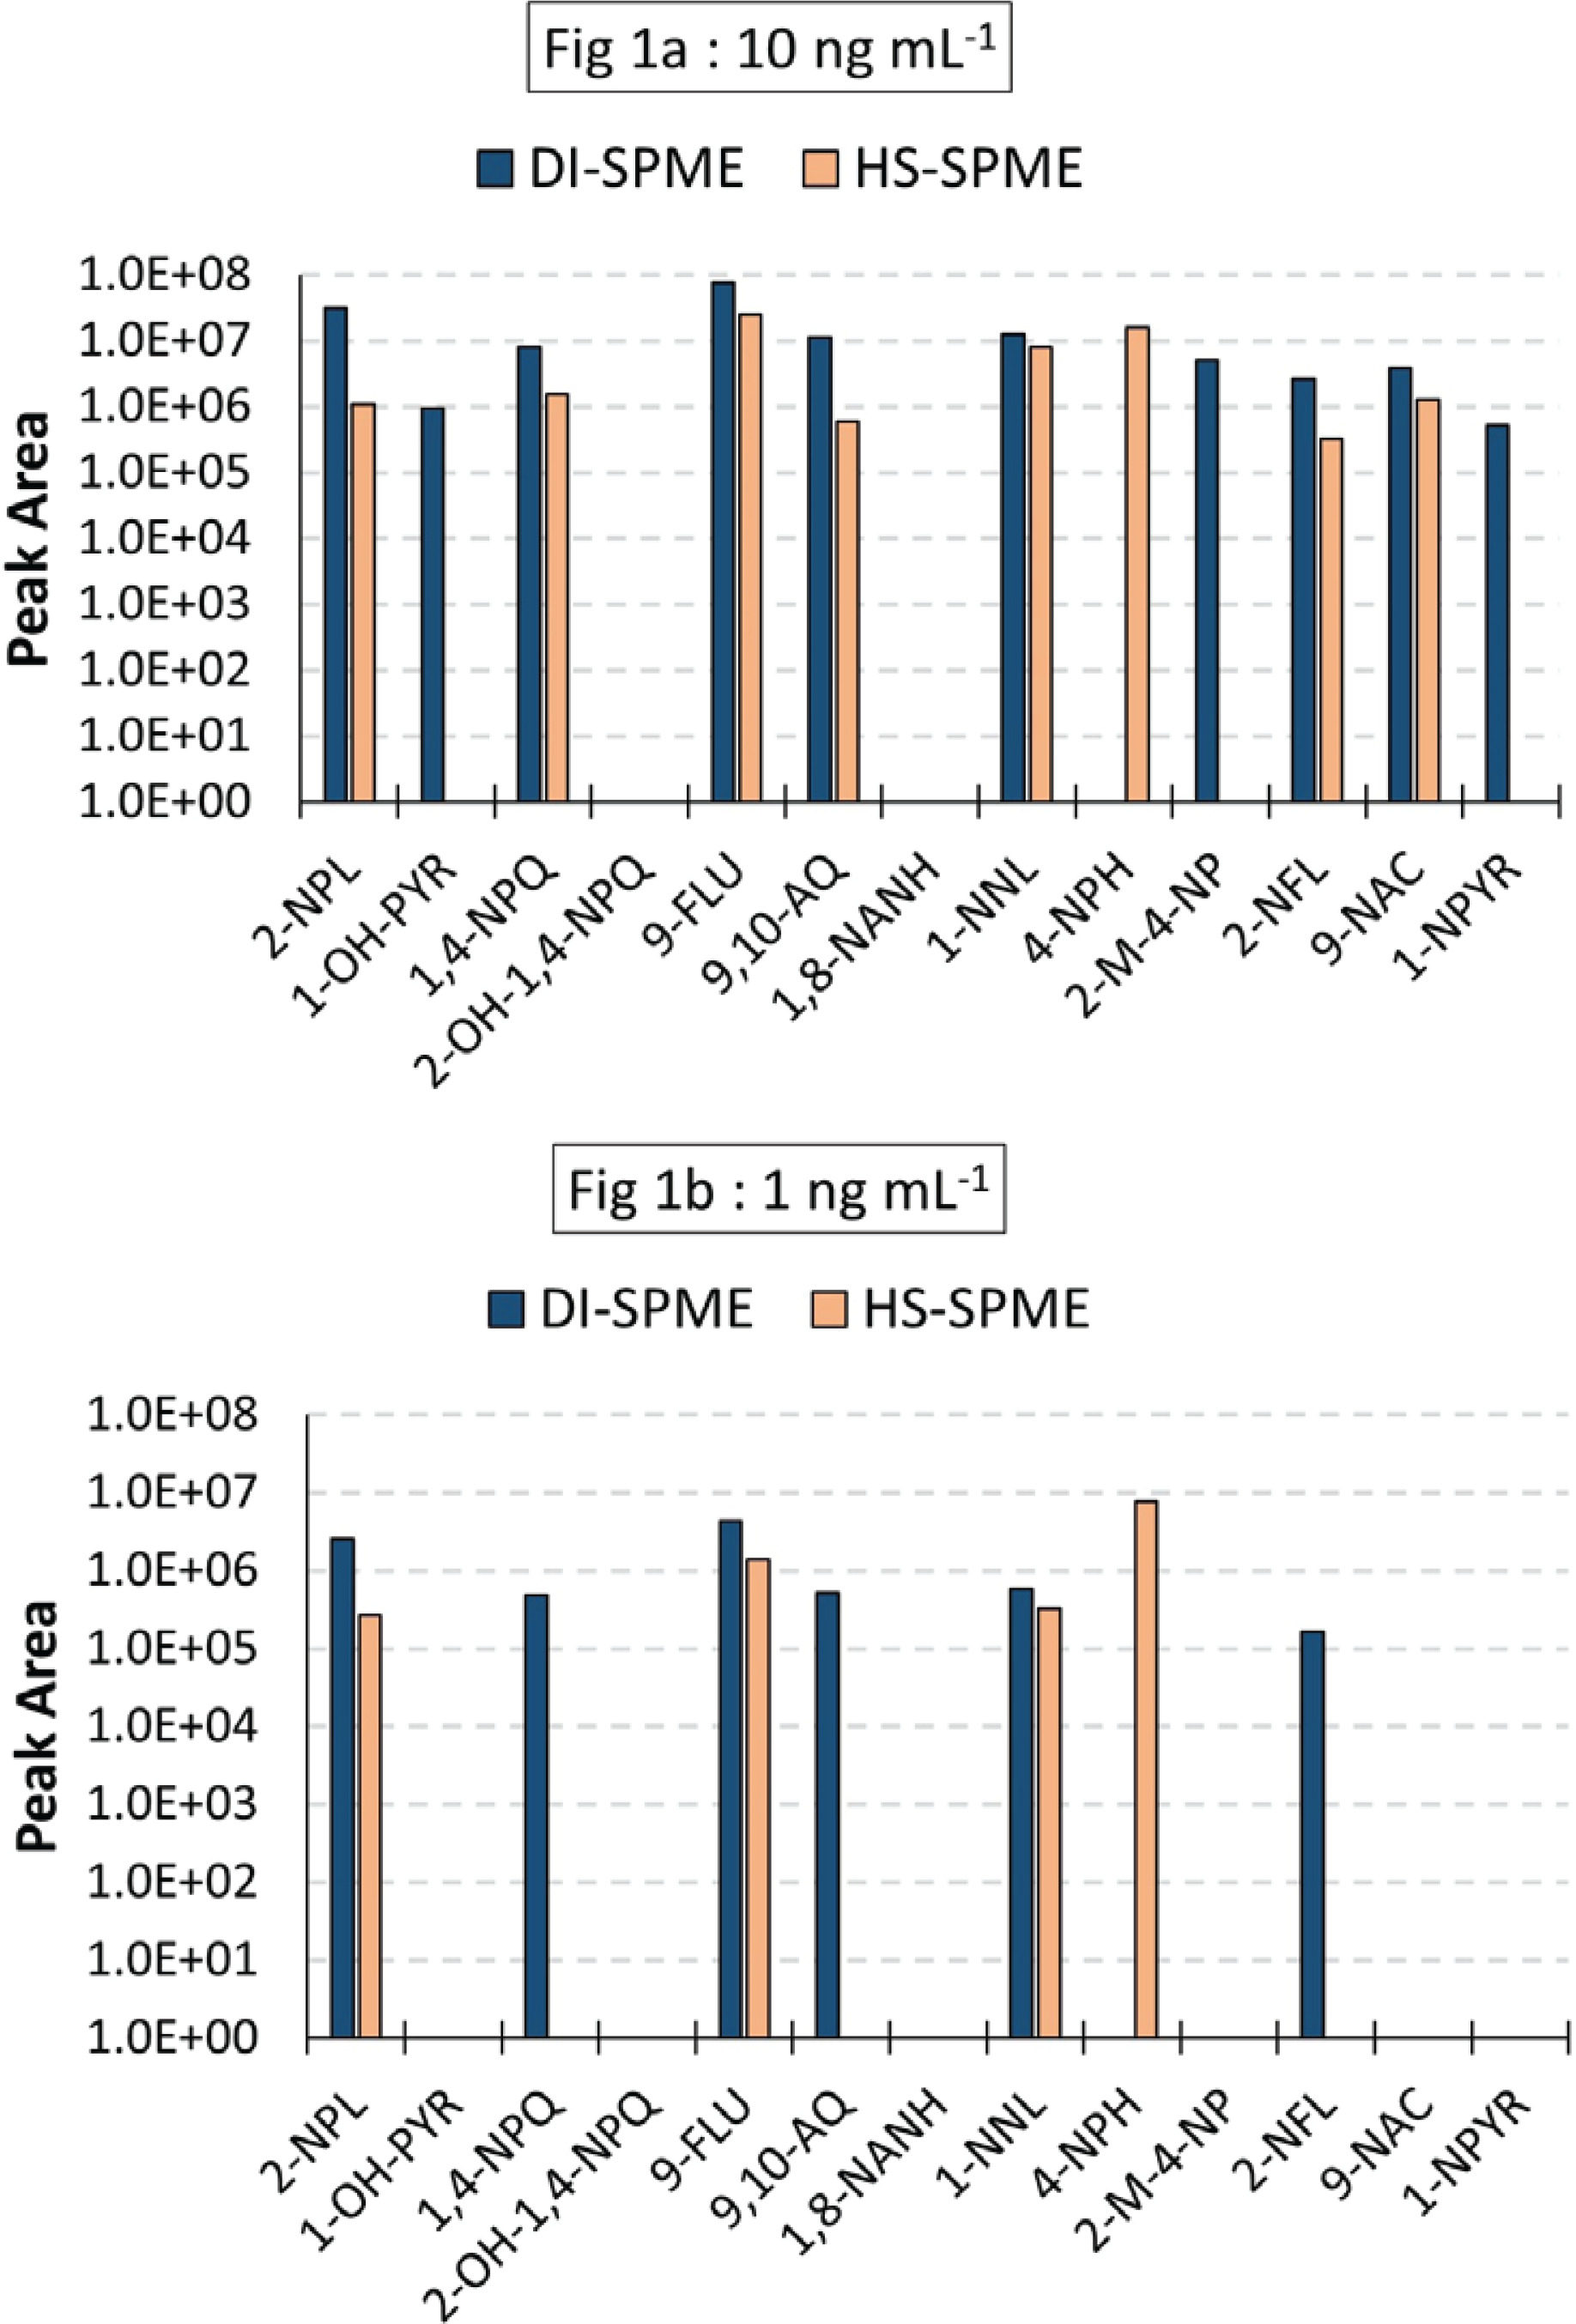
A mix of the 13 target compounds was prepared at concentrations of 1 and 10 ng/mL in water and analyzed using the same GC-MS/MS method employing either DI-SPME or HS-SPME. As shown on Figure 1a (10 ng/mL), two oxy-PAHs (2-OH-1; 4-NPQ; and 1,8-NANH) were not identified by either method at 10 ng/mL. The only compound that showed better sensitivity in HS-SPME and not quantified in DI-SPME was 4-NPH at concentration of 1 ng/mL and 10 ng/mL. At 1 ng/mL (Figure 1b), six compounds (2-NPL; 1,4-NPQ; 9-FLU; 9,10-AQ; 1-NNL; and 2-NFL) were quantified using DI-SPME and four compounds (2-NPL; 9-FLU; 1-NNL; and 4-NPH) using HS-SPME.
Dependence on sample extraction time and temperature
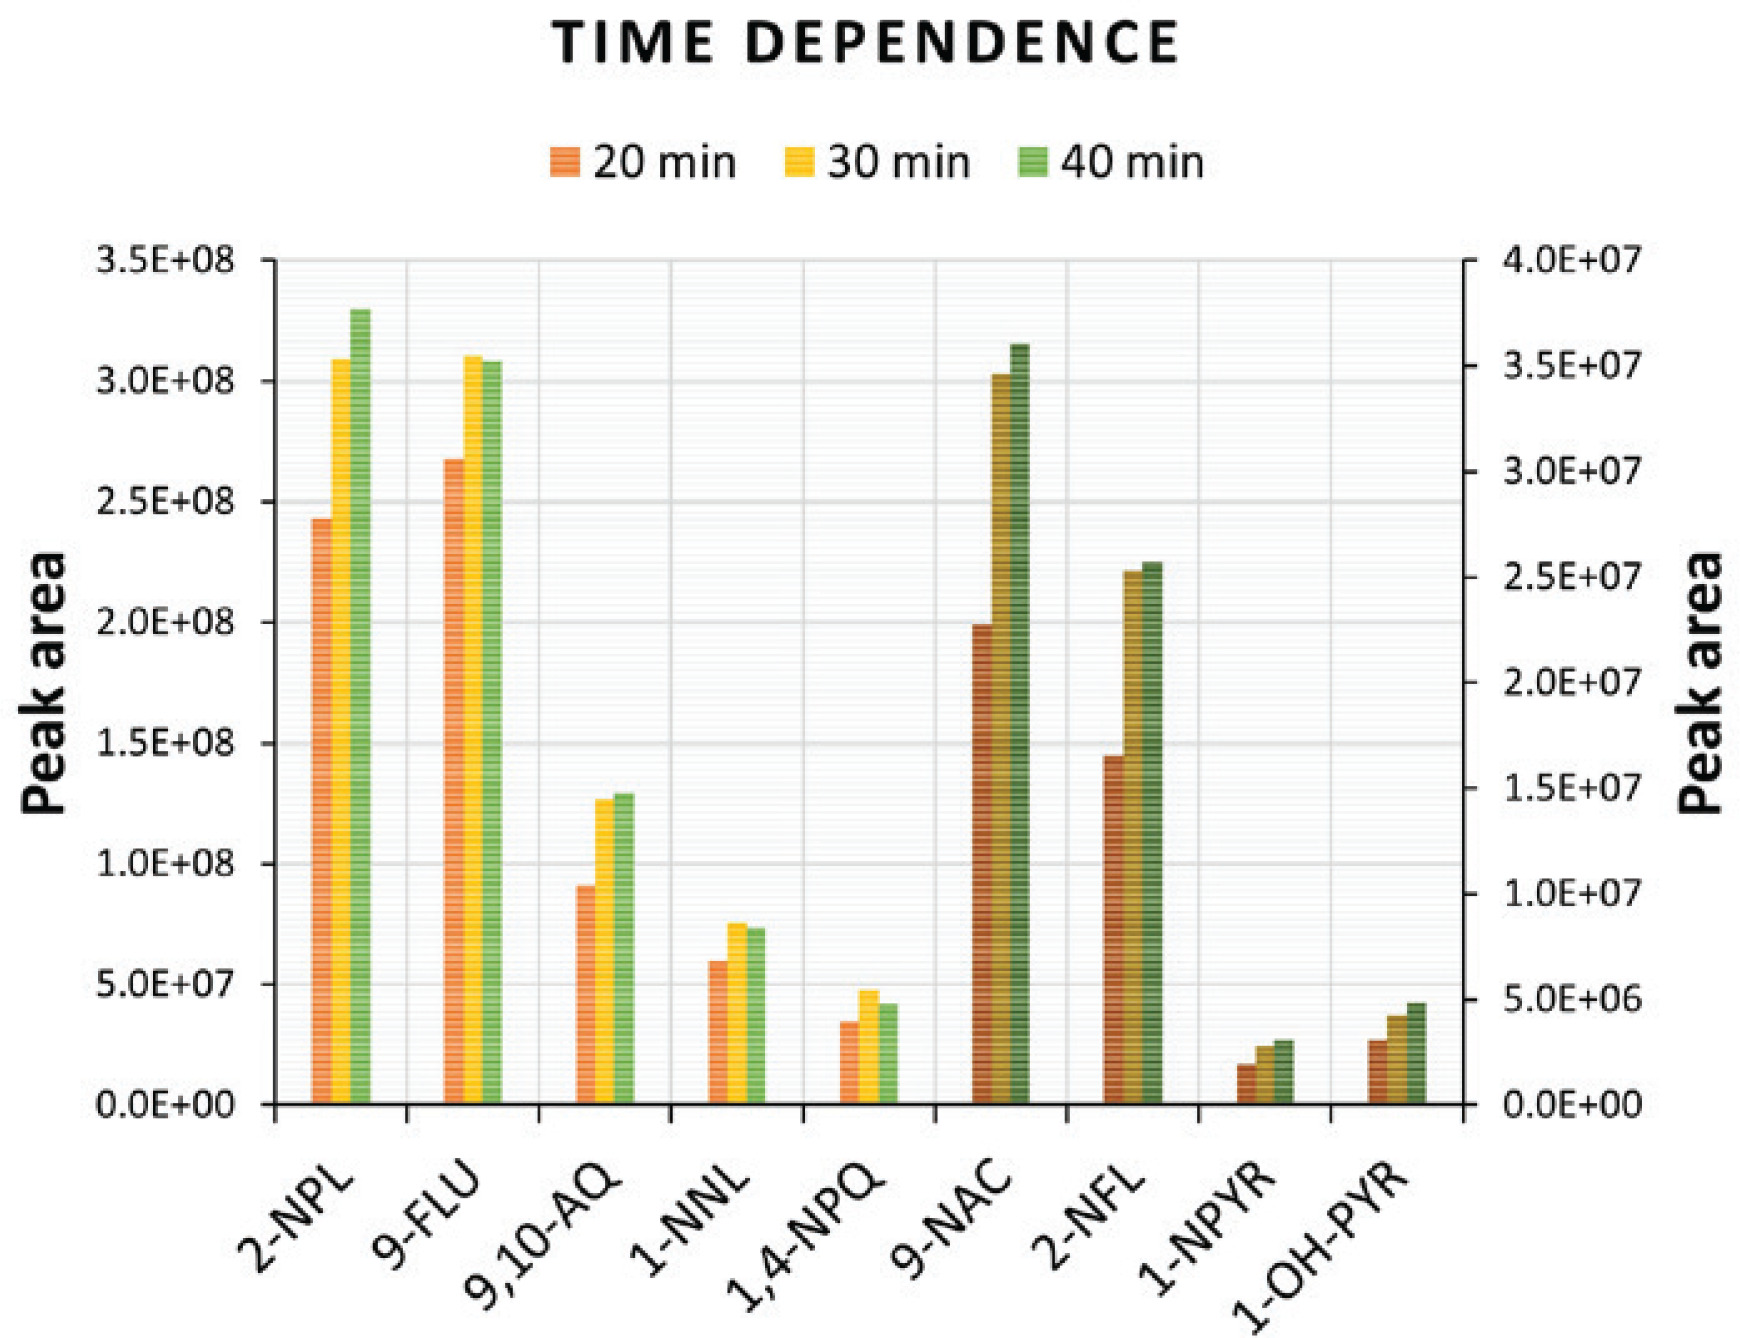
The extraction efficiency of target compounds from a sample mainly depends on the type of SPME fiber coating, the extraction time, and the temperature during the incubation step. In this study, we measured the extraction efficiency using the PDMS/DVB fiber in direct immersion as a function of extraction time and temperature. A 50 ng/mL mix of standards in water was used to compare extraction times of 20, 30, and 40 min at 70℃. The 20 min extraction time in Figure 2 shows a peak area of up to 40% lower than the 30 min and 40 min extraction time. However, the 30 min and 40 min extraction times showed similar peak areas, therefore, the 30 min extraction time was selected as an optimal time for analytes to reach equilibrium between the sample matrix and fiber stationary phase (PDMS/DVB) used in this study, and to reduce the total analysis time of samples.
Figure 2
Peak area of targeted compounds as a function of extraction time (20, 30, and 40 min). Light colors correspond to the left y-axis, while dark colors (9-NAC, 2-NFL, 1-NPYR, 1-OH-PYR) correspond to the right y-axis. The x-axis represents the names of PAH biomarkers and their derivatives
The extraction time was followed by an investigation of temperature dependence at 50, 60, 70, and 80℃ to choose the optimal working temperature for diffusion coefficients of analytes onto the fiber stationary phase. The peak areas of target compounds increased when increasing the temperature from 50℃ to 70℃, however, at 80℃ peak areas were reduced suggesting adsorbed chemicals may be desorbing from the fiber back to sample solution. Therefore, in our study, the optimal time and temperature used for extraction of PAHs biomarkers and PAHs derivatives from urine samples was set to 30 min at 70℃. Neither the time nor the temperature improved the extraction of: 2-OH-1; 4-NPQ; 1,8-NANH; and 4-NPH to be detected, while 2-M-4-NP in the 50 ng/mL mix of standards was below LOQ (100 ng/mL) (Table 2).
PAH biomarkers, nitro-PAHs, and oxy-PAHs in urine samples
One hundred urine samples from 20 participants who had completed visits 2 to 6 were analyzed on a GC-TQ-MS for the 13 compounds shown in Table 1. Analytes of interest were extracted from urine samples (see sample preparation) using DI-SPME at 70℃ for 30 min. To control the variation of urinary concentrations between different participants, all analytes’ concentrations (ng/mL) were normalized to creatinine levels (mg/mL) and they are shown in Table 4.
Table 4
Concentration (ng/mg) of PAH biomarkers normalized to creatinine. V2 corresponds to urine samples collected during visit 2 of cigarette smokers. V3 to V6 correspond to urine samples collected after participants switching to e-cigarettes
| Participant | V2 | V3 | V4 | V5 | V6 | V3-V6 Mean ± SD |
|---|---|---|---|---|---|---|
| 2-NPL | ||||||
| 9 | 16.6 | 24.3 | 23.3 | 11.6 | 11.2 | 17.6 ± 6.2 |
| 11 | 8.9 | 19.0 | 4.5 | 4.0 | 4.4 | 8.0 ± 6.3 |
| 12 | 40.1 | 3.5 | 3.0 | 4.3 | 4.0 | 3.7 ± 0.5 |
| 13 | 23.1 | 3.1 | 2.6 | 2.7 | 17.4 | 6.5 ± 6.3 |
| 15 | 36.8 | 12.4 | 14.3 | 12.3 | 73.2 | 28.1 ± 26.1 |
| 16 | 12.2 | 10.9 | 31.0 | 18.6 | 63.5 | 31.0 ± 20.1 |
| 18 | 8.7 | 5.3 | 4.9 | 3.9 | 2.6 | 4.2 ± 1.1 |
| 19 | 8.9 | 10.3 | 5.1 | 4.3 | 2.1 | 5.5 ± 3.1 |
| 20 | 23.2 | 2.6 | 5.0 | 3.0 | 2.4 | 3.3 ± 1.1 |
| 22 | 7.6 | 3.4 | 2.0 | 3.2 | 1.8 | 2.6 ± 0.7 |
| 29 | 6.5 | 3.6 | 7.5 | 6.3 | 12.8 | 7.6 ± 3.3 |
| 33 | 6.8 | 2.2 | 26.1 | 3.8 | ¶ | <10.7 ± 10.9 |
| 38 | 7.1 | 2.6 | 1.7 | 1.8 | 2.0 | 2.0 ± 0.3 |
| 46 | 11.2 | 6.6 | 1.7 | ¶ | 13.4 | <7.2 ± 4.8 |
| 47 | 20.2 | 18.5 | 13.9 | 3.5 | 15.6 | 12.9 ± 5.6 |
| 48 | 65.8 | 55.6 | 143.9 | 58.3 | 28.7 | 71.6 ± 43.3 |
| 49 | 0.04 | 0.1 | 0.1 | 0.3 | 0.1 | 0.15 ± 0.1 |
| 53 | 32.4 | 8.7 | 1.0 | 3.8 | 8.3 | 5.5 ± 3.2 |
| 1-OH-PYR | ||||||
| 13 | 174.8 | ¶ | ¶ | ¶ | 115.8 | <115.8 |
| 22 | 25.6 | § | § | § | ¶ | |
| 48 | 139.1 | 38.7 | 57.6 | 37.4 | 17.5 | 37.8 ± 14.2 |
The 2 PAHs biomarkers were quantified as follows, 2-NPL (Table 4) was quantified in 88 urine samples from 18 participants in a concentration range 0.04–65.8 ng/mg in samples of visit 2 (before switching to EC) and 0.1–143.9 ng/mg in samples from visit 3 (after switching to EC). 1-OH-PYR (Table 4) was detected (<LOQ) in 3 urine samples and quantified in 8 other samples from 3 participants in a concentration range 25.6–174.8 ng/mg in samples of visit 2, and from 17.5–115.8 ng/mg in samples from visit 3. Among the PAHs derivatives, two oxy-PAHs were quantified as follows: 1,4-NPQ (Table 5) was quantified in 5 urine samples and detected in 1 other sample from 2 participants, while 9-FLU (Table 5) was quantified in 14 urine samples and detected in 13 other samples from 6 participants. Two nitro-PAHs were quantified as follows: 1-NNL was quantified in 2 urine samples in the visits 2 (Table 5), while 2-NFL (Table 5) was quantified in 13 urine samples and detected in 5 other samples from 5 participants.
Table 5
Concentration (ng/mg) of PAH derivatives normalized to creatinine. V2 corresponds to urine samples collected during visit 2 of cigarette smokers. V3 to V6 correspond to urine samples collected after participants switching to e-cigarettes
| Participant | V2 | V3 | V4 | V5 | V6 | V3-V6 Mean ± SD |
|---|---|---|---|---|---|---|
| 1,4-NPQ | ||||||
| 19 | 5.7 | ¶ | ¶ | ¶ | ¶ | |
| 47 | 26.4 | 6.2 | § | 8.4 | 12.9 | <9.2 ± 2.8 |
| 9-FLU | ||||||
| 9 | 0.2 | § | § | § | § | |
| 16 | 0.1 | § | § | § | § | |
| 18 | 0.1 | 0.1 | ¶ | ¶ | ¶ | <0.1 |
| 22 | 1.2 | 0.2 | 0.3 | 0.1 | § | <0.2 ± 0.1 |
| 29 | 0.8 | 1.2 | 0.7 | § | § | <0.9 ± 0.2 |
| 33 | 0.8 | § | 0.7 | 0.35 | § | <0.5 ± 0.2 |
| 1-NNL | ||||||
| 18 | 1.2 | ¶ | ¶ | ¶ | ¶ | |
| 22 | 3.5 | ¶ | ¶ | ¶ | ¶ | |
| 2-NFL | ||||||
| 9 | 2.7 | 7.5 | 6.5 | 3.7 | 2.8 | 5.1 ± 1.9 |
| 26 | 7.25 | 3.4 | ¶ | ¶ | ¶ | |
| 47 | 11.6 | § | ¶ | 18.4 | 23.3 | <20.8 ± 2.4 |
| 48 | 5.5 | § | ¶ | ¶ | ¶ | |
| 53 | 13.6 | 10.6 | § | § | § | <10.6 |
DISCUSSION
The SPME method is known to simplify the sample preparation process by eliminating the need for solvents and extensive sample handling. Despite its efficacy and versatility, it still requires method development to optimize the extraction of analytes of interest. In this study, 1-OH-PYR and 2-M-4-NP were not detected using the HS-SPME method, likely due to their insufficient volatility in the gas phase or the potential incompatibility of the PDMS/DVB fiber coating used in the analysis. Loading a derivatizing reagent on the SPME fiber coating prior to analytes sampling is often used to increase compound volatility and thermal stability25. The silylation process using a derivatization reagent such as N,O-bis(trimethylsilyl)trifluoroacetamide (BSTFA) for carboxylic acids, phenols, amides and alcohols may enhance the selectivity and sensitivity of 1-OH-PYR and 2-M-4-NP in HS-SPME. On DI-SPME, 1-OH-PYR and 2-M-4-NP were detected at 5 and 50 ng/mL, respectively. The immersion of the fiber in the solution, better concentrates the dissolved organics at trace levels onto the fiber coating leading to higher sensitivity than HS-SPME for most of the target compounds used in this study. Therefore, we used DI-SPME for the analysis of urine samples. On the other hand, HS-SPME has multiple advantages over DI-SPME such as prolonged lifetime of the fiber because it remains relatively clean in the headspace, less interfering compounds adsorbed on the fiber, and the smaller amount of sample required.
Previous studies on PAH compounds showed that increasing the incubation temperature from 50 to 60℃ improves the peak areas of PAHs with 2 and 3 aromatic rings, whereas the highest increase was obtained at 70℃ for the PAHs with 4 aromatic rings such as fluoranthene and pyrene26,27. Moreover, the use of extraction temperatures of 80℃ and 90°C did not improve the sensitivity of PAHs and high molecular weight PAHs26.
In this study we only used the PDMS/DVB fiber coating bonded to a flexible fused silica core recommended by the manufacturer to extract VOCs, amines and nitroaromatics. However, other fiber coatings might improve the sensitivity of PAH biomarkers, nitro-aromatics and oxy-aromatics, such as: 1) fibers with polyacrylate coating for polar compounds, 2) a thin film of PDMS for large molecules27, 3) a PDMS/DVB coating bonding to nitinol with greater robustness and reproducibility than fused silica, and 4) SPME arrow fibers with faster extraction, larger sorption phase, long lifetime, and superior sensitivity than traditional SPME fibers.
While analytical methods targeting PAHs and their derivatives in biofluids are still limited, a few studies have reported the concentration of PAH derivative biomarkers or their metabolites in urine using HPLC-fluorescence and UPLC-MS/MS systems19,20. Carrizo et al.28 have employed atmospheric pressure solid analysis probe (ASAP) coupled with quadrupole-time of flight-mass spectrometry (Q-ToF-MS) to identify 9-nitroanthracene in saliva and 1,4-naphthoquinone in urine. Compared to previous analytical methods, the SPME method used in this study demonstrated good sensitivity for detecting various parent PAH derivatives.
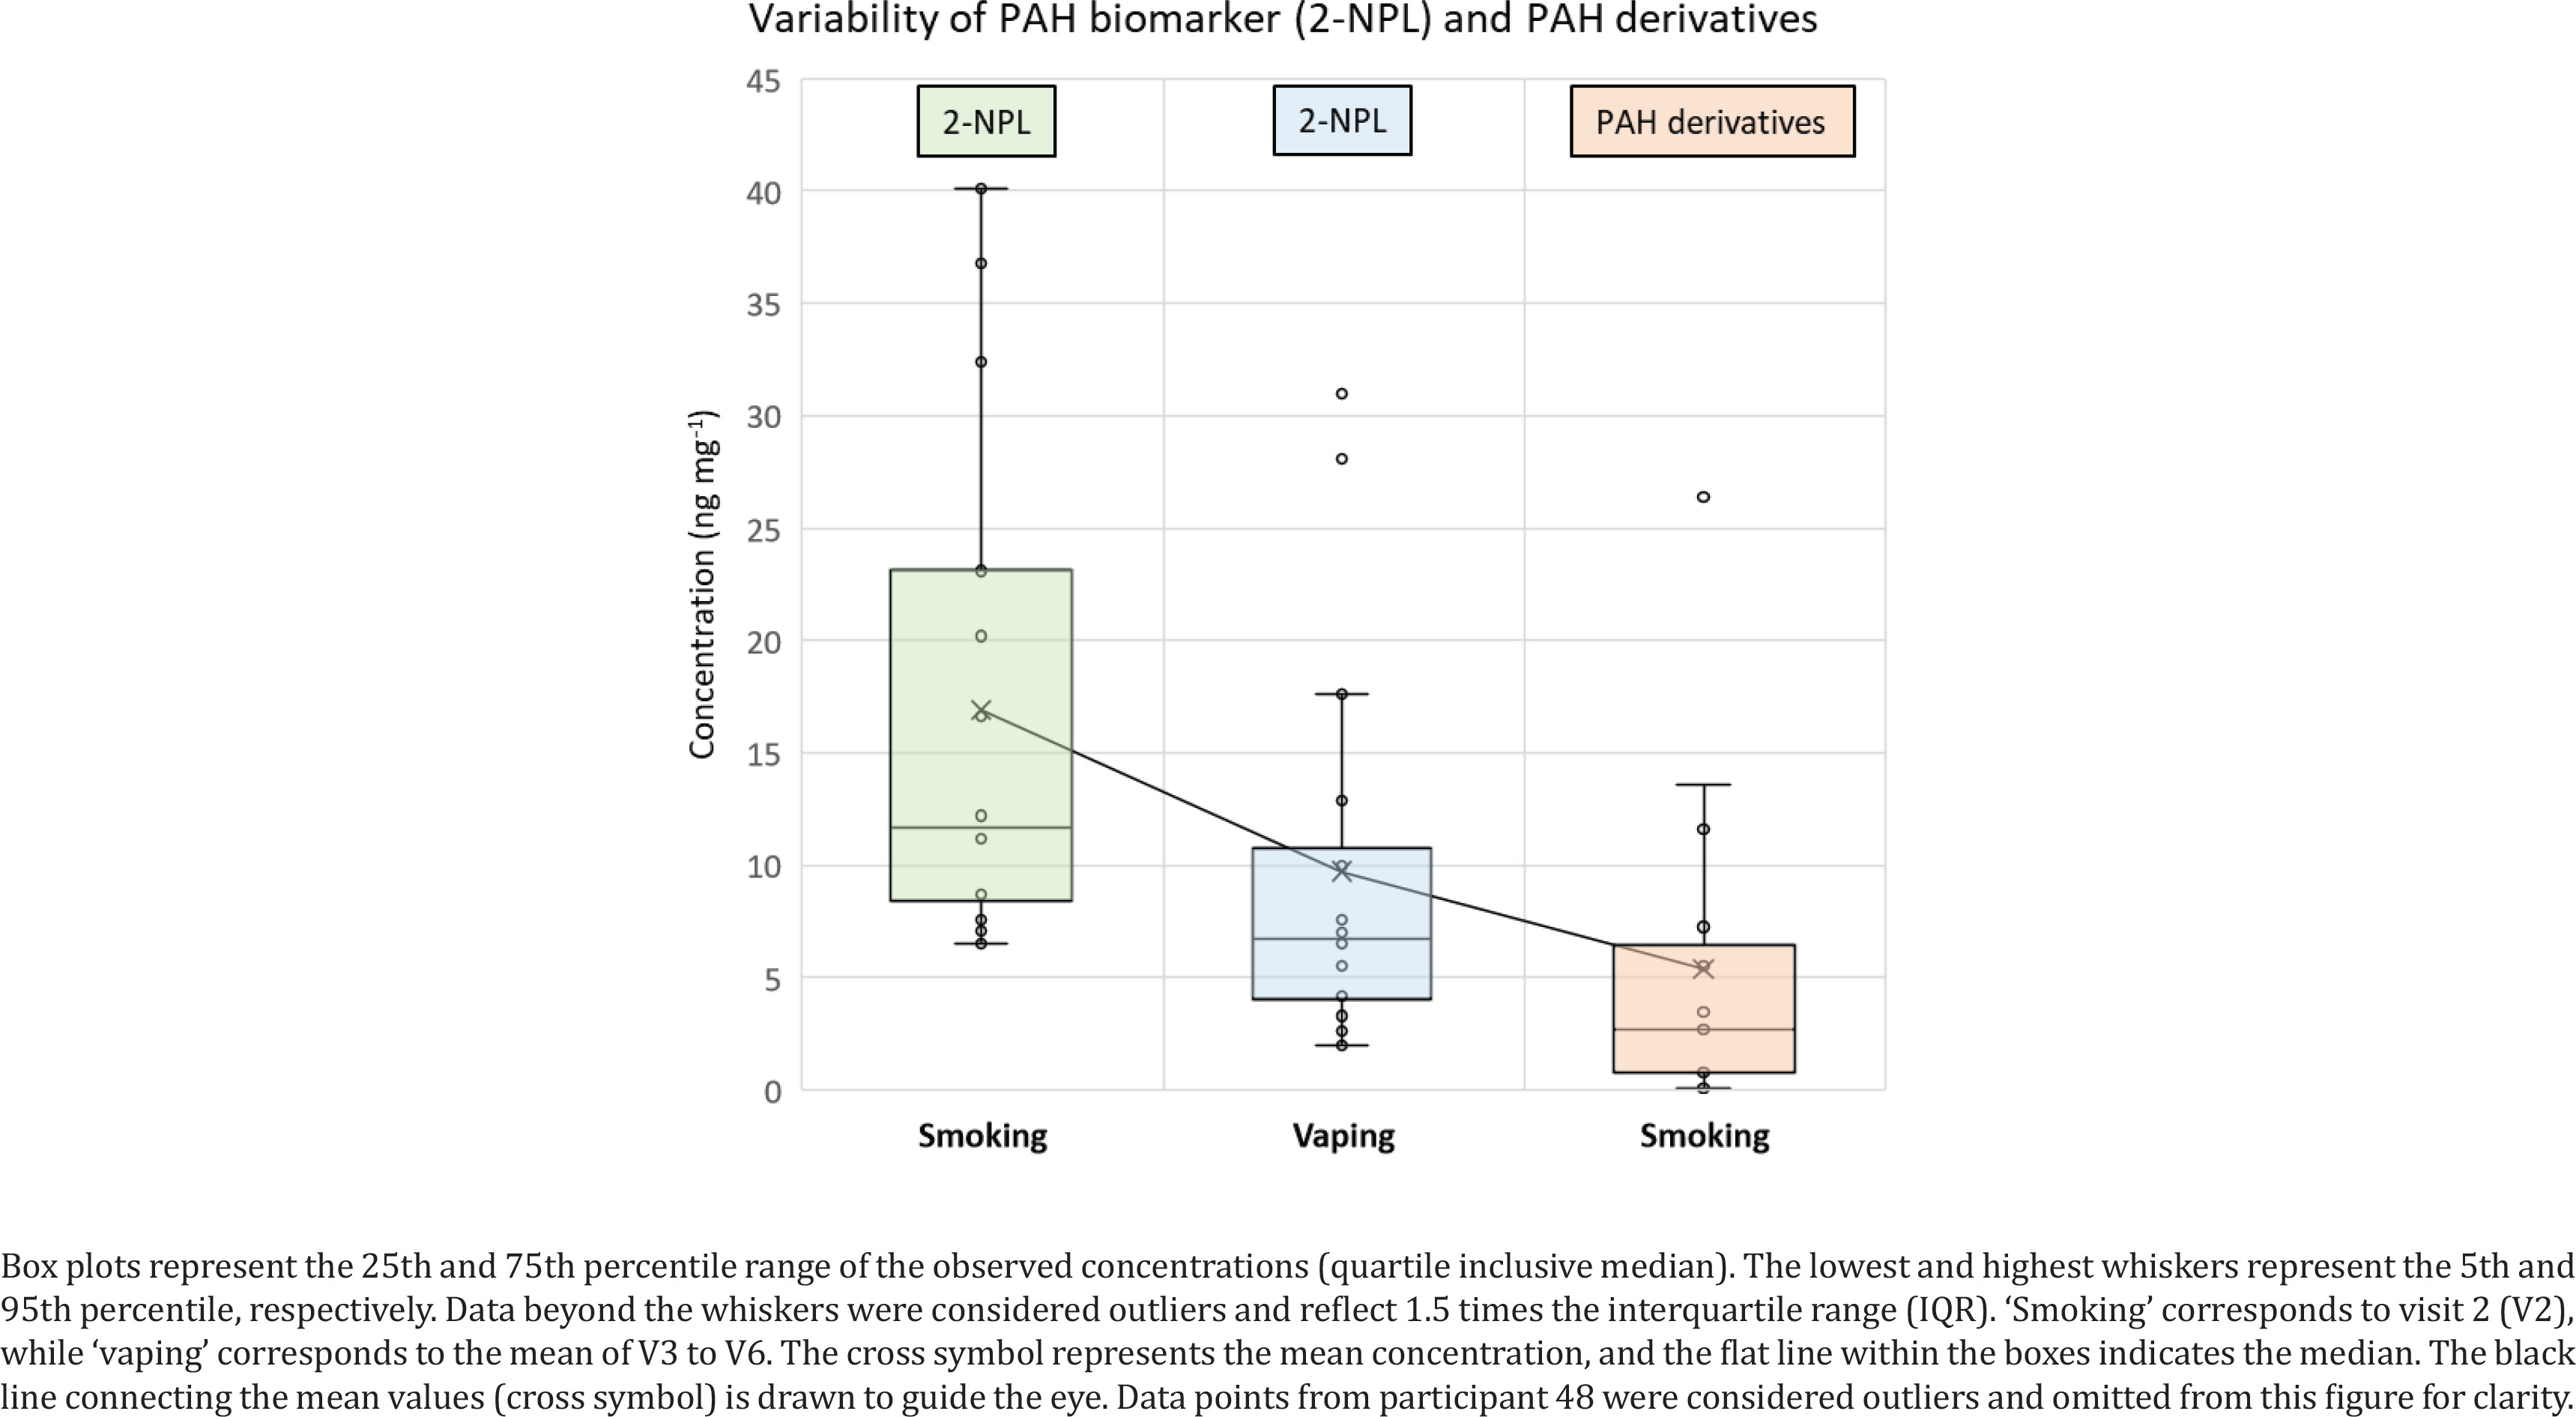
Results show that the mean concentrations at visits 3–6 have decreased significantly for each of the PAH biomarkers or its derivatives, after switching to e-cigarettes in 80% of cases. Figure 3 shows a mean value of PAH biomarker (2-NPL) in smokers about 70% higher than in vapers, and 215% higher than PAH derivatives mean value in smokers. 2-NPL was previously suggested as a better biomarker of PAHs rather than 1-OH-PYR in urine of smokers29. PAH derivatives in vapers have a lack of data (<LOD) in most samples and could not be accurately represented in Figure 3. Alternative analytical methods such as the soft chemical ionization (CI) technique have shown a better GC-MS sensitivity to nitrated and oxygenated aromatics8. The sensitivity may increase further by using the 2 cm SPME arrow fibers which can concentrate more analytes from the urine samples at lower temperature and shorter extraction time.
Figure 3
Concentration distribution of PAH biomarker (2-NPL) and PAH derivatives (1,4-NPQ; 9-FLU; 1-NNL; and 2-NFL) in urine of smokers and vapers
PAH levels from participants 48 and 33 increased significantly at visit 4, which may be due to normal daily routine of people’s exposure to certain emission sources other than tobacco, and therefore may introduce elevated levels of PAHs or PAH derivatives. It is worth noting that participants’ adhering to the study requirement of not smoking tobacco cigarettes for 28 days could only be verified by measuring the exhaled CO levels of the participant at the day of the visit, however, CO is a relatively short-lived biomarker and therefore is not a measure of complete abstinence. Collecting additional urine samples from participants after 28 days may improve the average result after switching to EC. The highest decrease in concentration between visit 2 and the mean of visits 3–6 was related to participants 12, 13, 20, 22, 38, and 53 showing a decrease in 2-NPL concentrations between 65% and 90% after switching to using ECs only. Participant 48 had shown elevated levels of PAH biomarkers (2-NPL and 1-OH-PYR) at visit 4, which contribute to the high mean value of 2-NPL, however, 1-OH-PYR concentration had decreased by 73% from visit 2 compared to the mean of visits 3–6. On the other hand, PAH derivatives were mainly quantified at visit 2. Quantifying PAHs derivatives in urine, saliva or serum is scarce in the literature, while their origins or mechanisms of formation in the human body are still unclear and not available in the literature. This requires more investigation in future studies.
A recent study review showed that tobacco-specific nitrosamine (TSNA) levels are much lower among people who exclusively vape compared to those who exclusively smoke24. TSNA levels are the lowest among people who neither smoke nor vape compared to people who vape. Similar findings for cotinine, 1-OH-PYR, VOCs, carbon monoxide (CO) and other toxicants biomarkers were found among a group of adults who exclusively vaped compared to those who exclusively smoked or dual used tobacco cigarettes and ECs30,31. To the best of our knowledge, only one study has previously identified a nitro-PAH (9-nitroanthracene) in saliva of smokers, where it was associated with direct emission from tobacco smoke28. A recent study compared emission factors of nitrated PAHs from various combustion sources including cigarette smoking32. They found that nitrated PAHs are primarily emitted from biomass burning, with only a few nitrated PAHs detected from cigarette smoking and cooking. Zhang et al.33 have reported that metabolites of nitrated PAHs (e.g. 1-amino-pyrene) in urine of diesel engine testers was not affected by smoking. Therefore, the presence of oxygenated and nitrated PAHs in urine samples is less likely to be directly inhaled from tobacco cigarettes, and thus the exposure to air pollution and occupational workplace and/or in-cigarette PAHs, followed by chemical transformation in the body, might be the major sources of PAH oxidative derivatives in human urine.
Previous studies have reported that chemicals adsorbed on the surface of airborne particles can induce the production of reactive oxygen species (ROS) and reactive nitrogen species (RNS) when inhaled34,35. This process is believed to be a key mechanism leading to metabolic disorders and adverse health outcomes. Therefore, the presence of PAH derivatives in urine could also be related to the biotransformation of inhaled parent PAHs from tobacco cigarettes into their oxygenated and nitrated forms via cellular reactive oxygen and nitrogen species (ROS and RNS) produced in both the liver and mitochondria.
There is a lack of data on PAHs derivatives in biofluids and on whether these derivatives are a result of a direct exposure to oxy- and nitro-PAHs from tobacco cigarettes or from outdoor and indoor environments, or the PAHs derivatives mainly originate from biotransformation in the human body.
Finally, our findings on PAH biomarkers and derivatives support the existing literature indicating that switching from smoking to vaping reduces exposure to harmful organic chemicals but may not entirely eliminate the risk of developing health issues such as lung disease. Additionally, there is growing concern about metal emissions from EC components, including nickel, chromium, lead, cadmium, and tin, which increase the health risks associated with vaping. Individuals who have never smoked should not start vaping to avoid the addictive consequences, and potential health, and mental health issues which could lead to the initiation of tobacco cigarette use36.
Limitations
PAH biomarkers in urine are commonly used to assess human exposure to polycyclic aromatic hydrocarbons (PAHs). However, some limitations need to be considered when targeting PAH biomarkers in the urine of smokers and vapers, such as multiple sources of exposure (PAHs can originate from various sources, other than smoking or vaping, limiting an accurate assessment of specific exposure sources), short detection window (PAH biomarkers have a limited detection window, usually 24 to 48 hours, potentially missing exposures that occurred outside this timeframe), variations in metabolism (individual differences in metabolism can affect biomarker levels, leading to variability in results), specificity of biomarkers (some PAH biomarkers may not be specific to certain PAHs, reducing the accuracy of the exposure assessment) and influence of diet (dietary intake can also contribute to PAH levels in urine and affect biomarker data of specific exposure sources).
CONCLUSIONS
This study showed for the first time the feasibility of using SPME fibers to quantify PAH biomarkers and PAH derivatives in the urine of smokers and vapers. DI-SPME showed a high extraction efficiency for PAH biomarkers and PAH derivatives in comparison with the HS-SPME and SPE-LI methods. We achieved a better sensitivity on the GC-TQ-MS in comparison with the SPE-LI method on GC-SQ-MS. Using a soft chemical ionization (CI) technique on the GC-TQ-MS in addition to the use of SPME arrow fibers, known for their larger sorption phase, would be advantageous to achieve low detection limits for nitrated and oxygenated PAHs in future studies. Our data from 80% of the participants demonstrate a decrease of up to 90% in concentrations of PAHs and its derivatives following the transition to ECs from cigarettes. However, consumers must be aware that using ECs alone is not harmless, and dual-use of ECs with tobacco cigarettes is associated with higher risk than ECs alone or no use. Finally, the use of vapes instead of smoking may reduce the risk of developing health diseases but consumers should stop smoking and vaping completely to minimize their exposure to harmful chemicals such as PAHs from ECs and therefore maximize the potential health benefits. Due to limited data on PAH derivatives in biofluids in the literature, future studies should focus on the potential formation pathways of PAH derivatives in the human body and their correlation with emitted parent PAHs from tobacco cigarettes and vapes.